

What exactly does one mean when they say somebody is thin, fat, athletic or chubby? Body size and shape can be described by dozens of words, whose specific meaning seem to vary from person to person. For example, patients with anorexia nervosa have a notoriously distorted conception of what constitutes a normal weight, at least when it comes to their own body. Our understanding of body image distortions and body dissatisfaction could be improved by better characterising what people put behind weight labels.
A number of studies have followed a same logic in order to probe the content of weight labels. Participants are asked to show, using a pictorial scale (see below), which body best corresponds to different words. Their results show two important things. Firstly, each word is associated with slightly different bodies, even when they can be thought of as synonyms. Secondly, participants' responses are more variable for some words than others. Each word does not necessarily describe bodies with the same level of precision. Does this variability reveal inter-individual variability, or uncertainty about the word itself?
To find out, we conducted a study to better describe the "intrinsic" variability of weight labels. This question was important in the context of my PhD (in French), which focused on the influence of others on our body representation. We wanted to better characterise the information that people conveyed when they described someone as ‘fat’ or ‘thin’.
The mail goal was to describe each weight label with a probability distribution that could spread over several body types, rather than with a single data point. We therefore wanted to describe each label by its position (its central tendency, its average value), but also by its dispersion (its spread, its precision). We also wanted a distribution that could be asymmetrical and easy to parametrise using the participants' responses. The distribution we finally used is called the PERT or beta-PERT distribution. It requires only three data points: a minimum, a maximum and a mode. It also has the advantage of being smooth (unlike a triangular distribution).
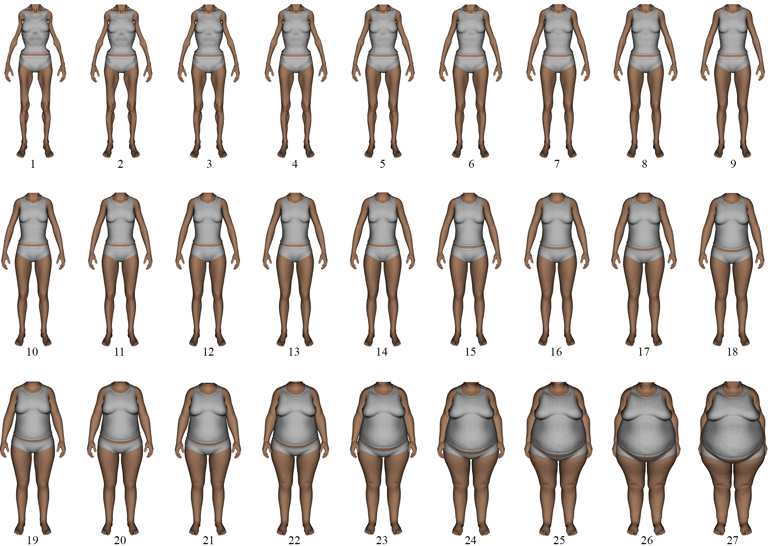
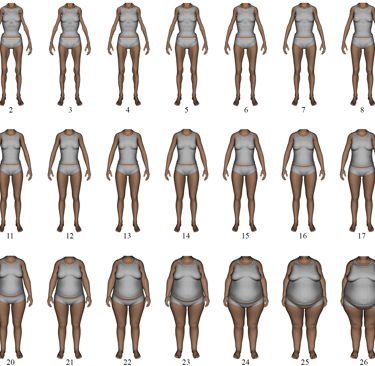
The Computer-Generated Figure Rating Scale (CGFRS; Moussally et al., 2017) is an example of pictorial scale that we used in our study.
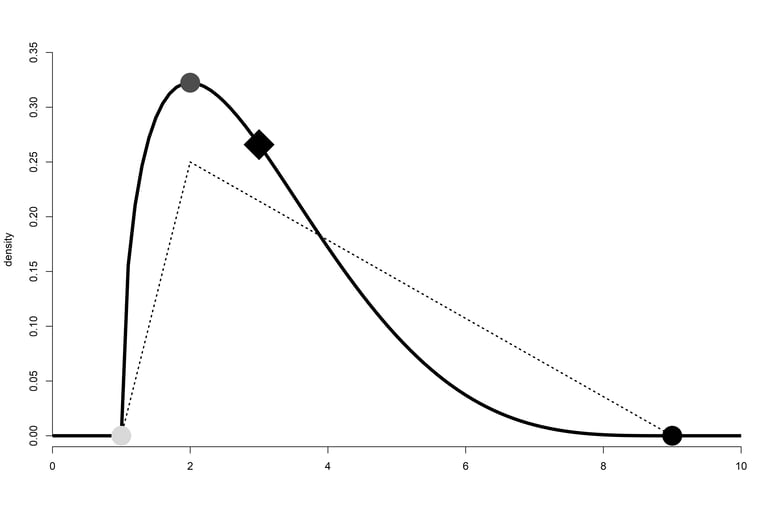
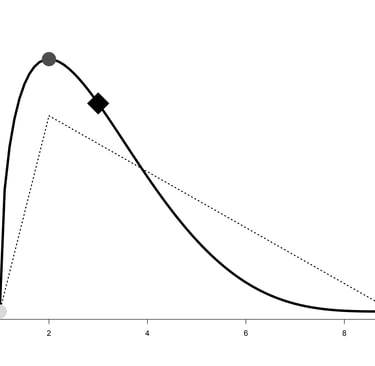
An example of a PERT distribution showing its minimum (light grey dot), maximum (black dot), and its mode (dark grey dot). The diamond shows the mean of the distribution. The dotted lines show a triangular distribution with the same parameters.
We asked participants (n = 259 women) to match a set of weight labels with bodies. For each label, they had to pick the body that best corresponded (mode), but also the thinnest (minimum) and fattest (maximum) bodies to which the label could be applied. Each label can mean different things, and this variability can be represented in two ways with our method:
the interindividual variability of the "average" meaning of the label, by averaging the distributions obtained with each participant
the "intrinsic" variability of the meaning of the label, by pooling all participants' responses and averaging each parameter individually: this reflects how precise or vague the word is
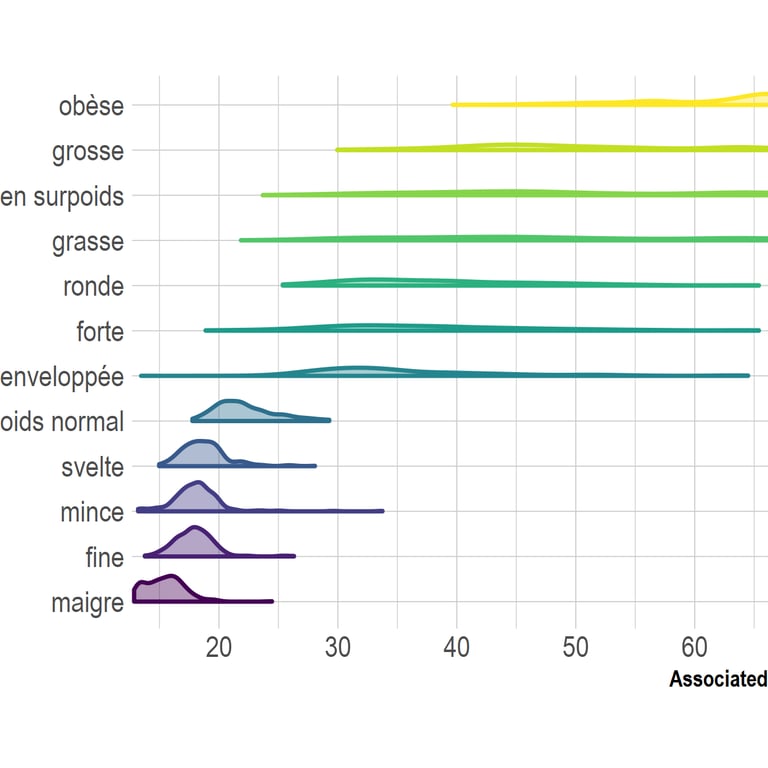
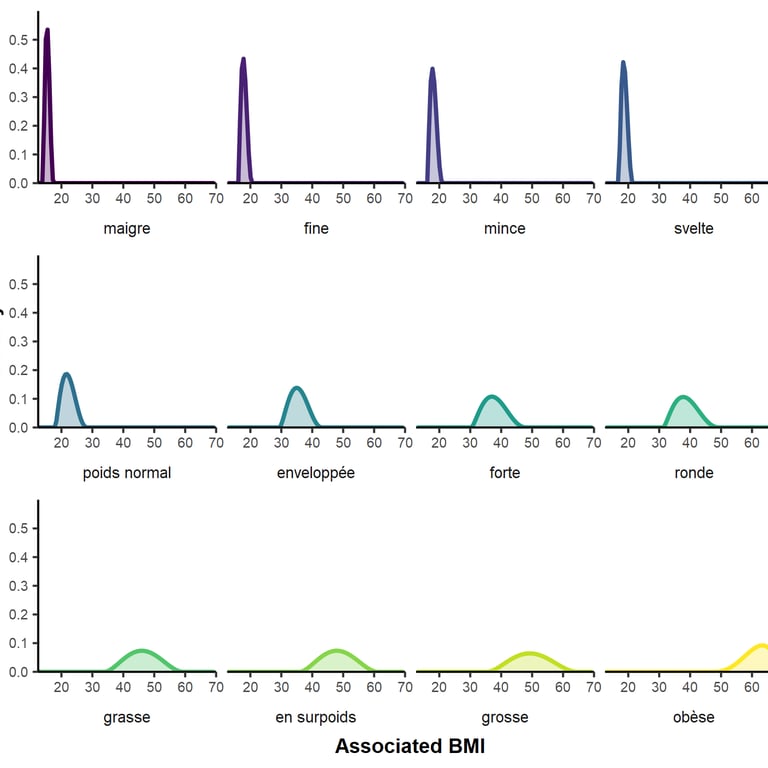
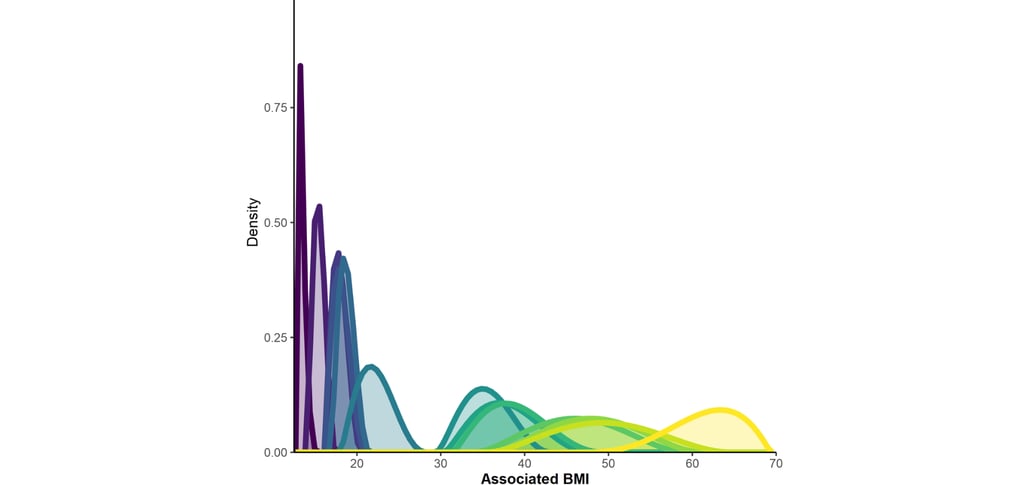
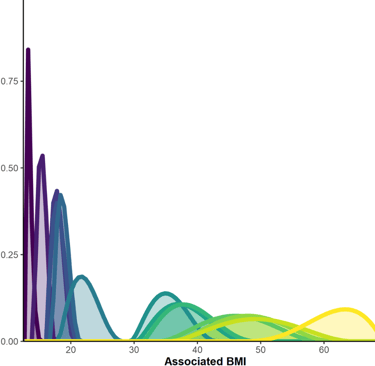
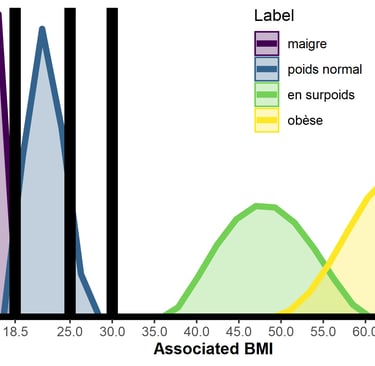
Each label is associated to different BMIs from one person to the other (figure 1), but also corresponds to a more or less specific body type (figure 2). Click to enlarge.
From top to bottom, the words (approximately) mean:
Obese, Fat, Overweight, Chubby, Plump, Big, Well-padded, Normal weight, Slender, Thin, Slim, Skinny.
Of course, as always, these results are not entirely satisfactory. For a start, we would need to validate this measure and check its test-retest reliability. I think it would also be better to be more lenient with the type of distribution itself. What I mean is that even though Beta-PERT distributions are overall a good candidate, some words could be best described by fairly different distributions, i.e., gaussian, bimodal, uniform, or weirder ones. If we want to develop this method further, it will also be essential to assess the extent to which the results depend on the specific stimuli we have used, by using different scales. Finally, this study focused on women's reactions to women's bodies, but an analysis of more diverse populations and stimuli would be necessary to generalise our conclusions.
I still think that the gist of the protocol opens up interesting perspectives, especially in health psychology. Patients with eating disorders, especially anorexia nervosa, have a distorted view of their own bodies. Some results suggest that women with high body dissatisfaction perceive the boundary between normal weight and overweight differently. In a research context, the method we propose could provide a better understanding of these distortions in weight-related vocabulary and their relationship to body dissatisfaction. In a clinical context, it could also help to characterise patients' conceptions about normal weight and overweight. Further research is needed to test these perspectives.
A final note to researchers: we might develop an adaptable online version of this task and analysis method. Let me know if you would be interested!
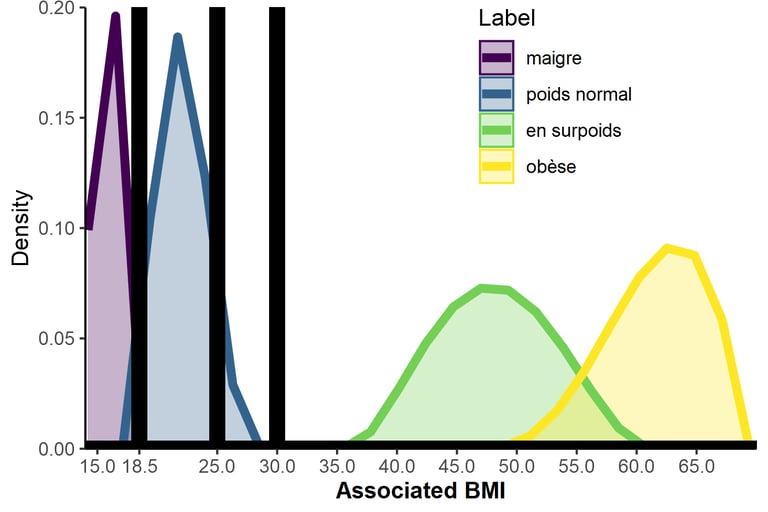
Another illustration of our results: in our sample, women seemed to overestimate the BMI needed to be considered obese according to World Health Organisation standards. This result is consistent with other studies, but keep in mind it could depend on the scale used or the words we tested.