A sizable part of my postdoc in Marko Nardini’s lab at Durham University has been dedicated to investigating the stability and specificity of audiovisual integration: How does it vary from one individual to another, from one moment to the next, from one pair of cues to another, from familiar to new sensory cues?
Why you should care about cue normalisation
An important aspect of this question involves comparing multisensory benefits – for example, checking whether your ability to integrate two cues correlates with your ability to integrate two different cues. The problem is, some cues are notoriously more reliable than others, making comparisons difficult.
Simply put, some (typically visual) cues are comparatively so good that the expected benefits of adding another less reliable cue become very small. I guess this technical limitation played an important role in the success of the notion of visual dominance in the earlier literature (see also the concept of “visual capture”).
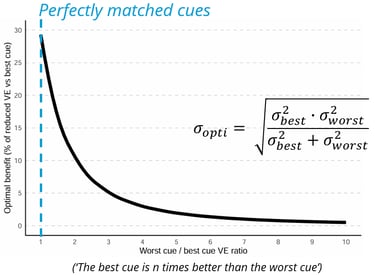
The reduction in the expected benefit stems directly from the ML equations we use to predict the optimal variance. These equations predict that cues are weighted by their reliabilities, such that the information added by a new cue should reduce the amount of variable error (say, the variance) compared to when only the best cue is available. However, as can be seen on this plot, the benefit quickly decreases as the variable error ratio between the best and worst cues increases. This has also been commented in earlier work by Marko and the brilliant Meike Scheller.
Comments
This plot shows the expected optimal benefit as a function of the mismatch between the cues. The expected benefit quickly drops when the mismatch grows, making the benefits harder to detect. The blue line shows perfectly matched cues and the maximum benefit (about 30% of error reduction).
Cue ratios got significantly closer to 1 when we normalised using the directional task (1 is a perfect match).
As you can see on the plot above, this small difference turned out to matter in our case (although some of this spectacular difference is also due to making the dots slightly harder and the pitch mapping slightly easier). The worst/best cue ratios were significantly closer to 1 in the directional 2AFC task than in the oddity task. A good case study of why normalisation requires careful consideration.
Poster
We made a poster about this and our RA Sophia Hand presented it at EPS London 2026 – you can see it here, but to conclude in an utterly postmodern fashion: Normalisation is not method-neutral.